Appendix
The following graphics were created using Census Local Area Profiles data from Statistics Canada (2017)
Figure A1. Voter Turnout in Federal Elections
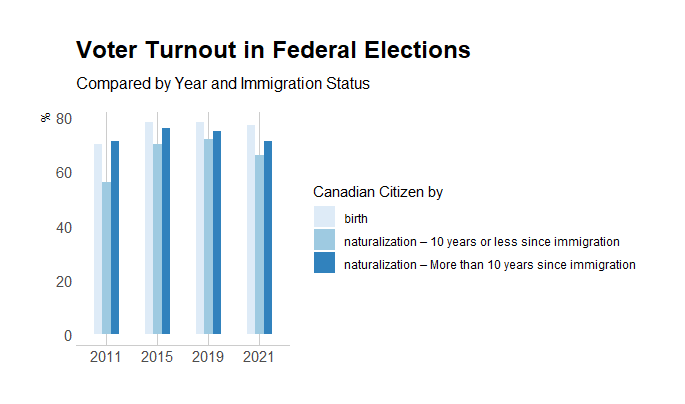
Figure A2. Recent Vancouver Immigrants by Local Area
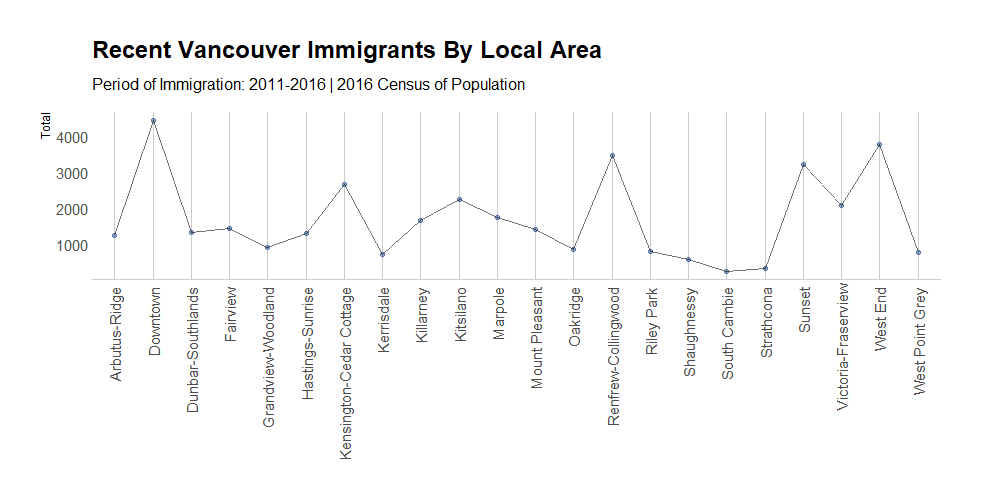
Note. The figure shows the areas where immigrants between 2011-2016 are migrating towards; popular destinations include Downtown Vancouver, Renfrew-Collingwood and the West End.
Figure A3. Proportion of Immigrants by Local Area
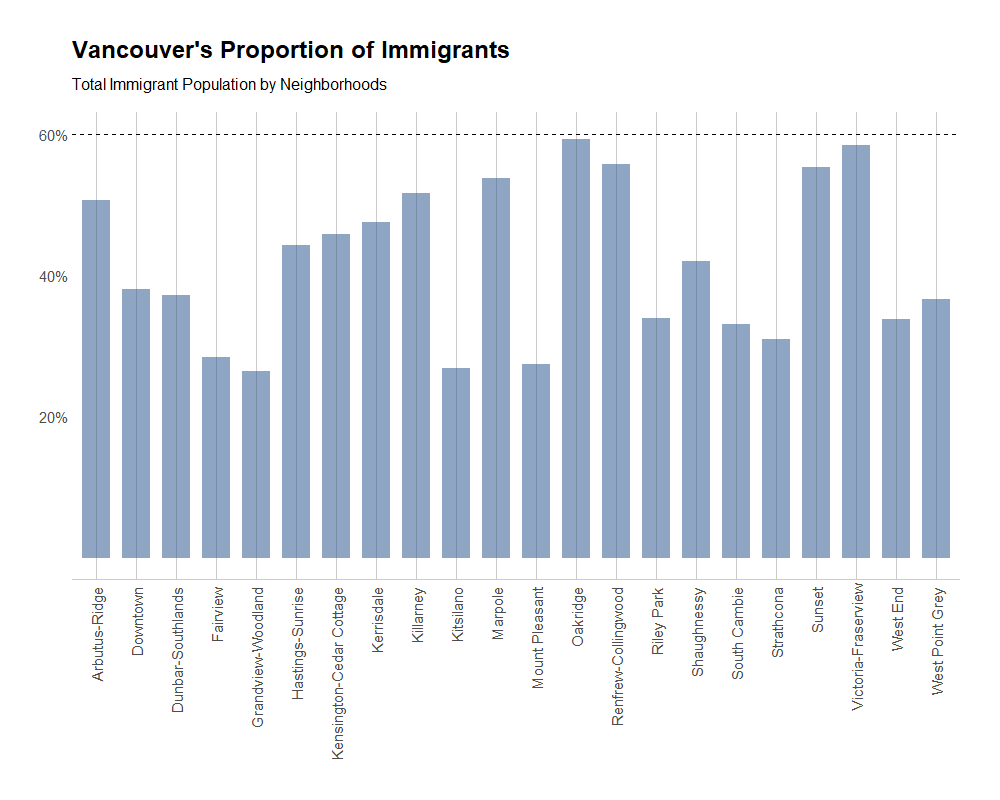
Note. We observe that certain neighbourhoods have a significantly high proportion of immigrants. This includes Oakridge, Sunset, Renfrew-Collingwood, and Victoria-Fraserview, where immigrants make up approximately 50% of the total local population. Between Figure A2 and A3, there is a high uptick of recent immigrants Downtown, but they make up a smaller proportion of the population. We can see that new immigrants are attracted to downtown and over time, this may saturate the population.
Figure A4. Proportion of Recent Immigrants from Asia
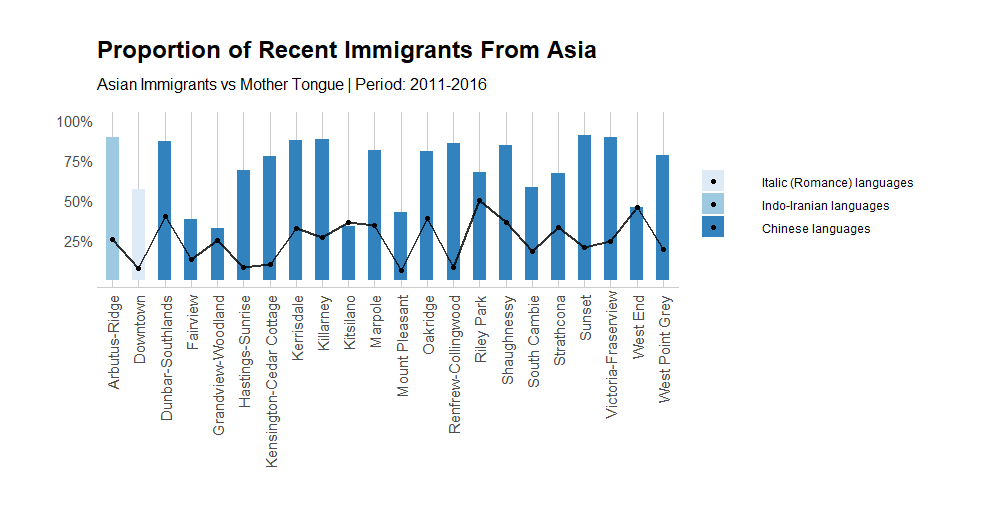
Note 1. The colour of the graphs shows which mother tongue is the most dominant in each local area. The line on the graph shows the percentage that the dominant-language mother tongue is present in the neighbourhood.
Note 2. Exploring further into the data (Figure A4), we find that a high proportion of the immigrants are from Asian countries. This is especially important because we must tailor our policy approaches to the most relevant subgroups in a meaningful way; this is especially true for Arbutus-Ridge, Dunbar-Southlands, Kerrisdale, Killarney, Marpole, Sunset, Victoria-Fraserview.
Note 3. The data is coloured by the dominant mother-tongue language in a neighbourhood, and the line shows the percentage of the language versus the total of all other languages. The data is from a single response category and does not capture multiple responses, however, the total number of recorded multiple responses was negligible compared to the overall population.
Figure A5. Recent Asian Immigrants by Place of Birth
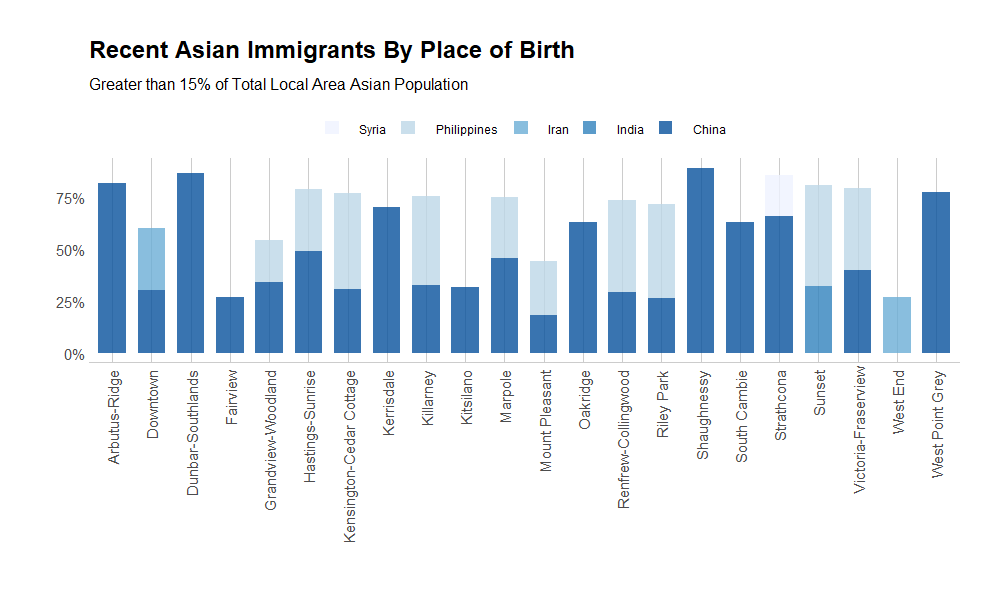
Figure A6. Knowledge of Official Languages
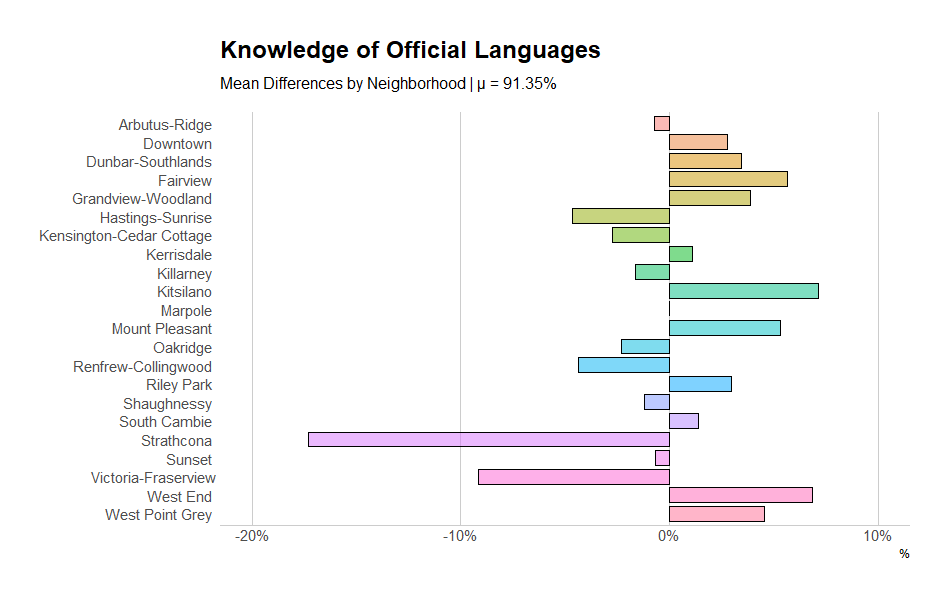
Figure A7. Do Not Speak English or French
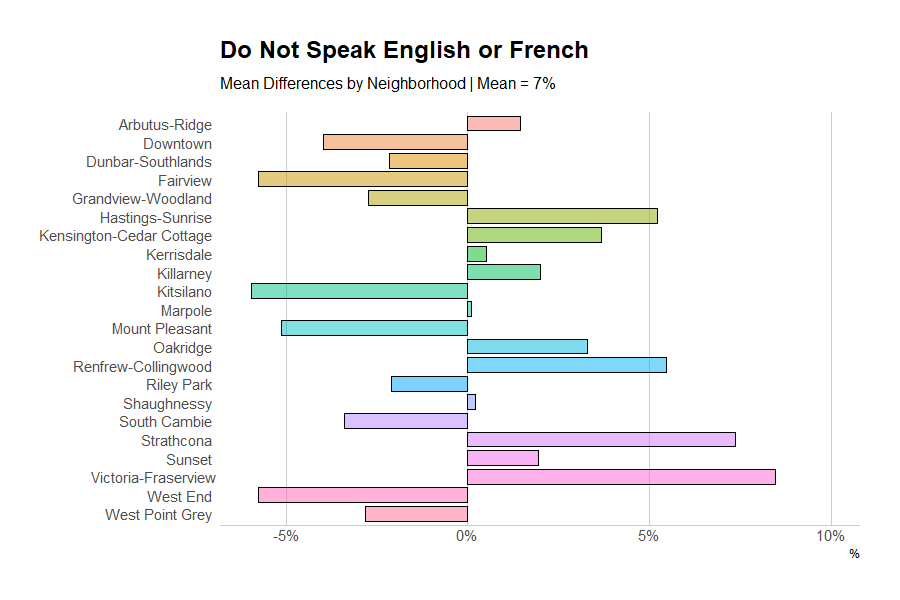
Note. The graph explains that approximately 12% of Renfrew-Collingwood and Hastings-Sunrise, as well as 15% of Strathcona and Victoria-Fraserview’s residents, cannot understand English or French.